- DeFi Dev Corp. (Nasdaq: DFDV)
- Posts
- Issuing SPS Guidance: Projecting 261% Growth by Mid-2026, 1 SOL per Share by 2028
Issuing SPS Guidance: Projecting 261% Growth by Mid-2026, 1 SOL per Share by 2028
Today, we’re setting our first formal SPS target, outlining a clear path to 261% growth in just twelve months. It’s an ambitious, but realistic, first step toward our goal of reaching 1 SOL per share by the end of 2028.
At DeFi Development Corp., we’ve always said SOL per share (SPS) is our North Star. It’s the single most important performance metric that indicates whether we’re delivering long-term value to shareholders in a way that compounds.
Today, we’re offering our first formal guidance on that metric.
We are targeting 0.165 SPS by June 2026, an approximate +261% increase from today’s reading of 0.0457 SPS.
This isn’t a finish line. It’s the first milestone on what we believe is a credible march toward a much bigger medium-term goal: 1 SOL per Share by December 2028.
This post outlines how we arrived at our 12-month target, why we believe it’s achievable, and how it can serve as a template for evaluating forward guidance in our business and the broader industry.
Recap: Our SPS Flywheel
Recall that SPS = Total SOL in Treasury / Total Shares Outstanding. Put simply, SPS reflects how much SOL each share - and by extension, each shareholder - effectively holds through their ownership of DFDV.
There are currently three core drivers of SPS growth:
Accretive Capital Raises: Raising capital above NAV and converting it into SOL.
Validator Compounding: Earning staking rewards, both from our own SOL and third-party delegated stake in excess of the global average staking rate through our high-performance validators.
Enhanced Yield Strategies: Discounted, locked SOL purchases and onchain activities.
These mechanisms increase the numerator, total SOL, while share count grows more slowly. The more efficiently we raise and deploy capital, the more SPS grows. We’ve already seen early proof points that our approach works: since May 6, 2025, SPS has increased by 60% even as shares outstanding increased by 32%. And because validator rewards and enhanced staking yields are recurring, we expect that growth to compound.
Modeling Our Path to 261% SPS Growth
We began by modeling a range of capital raise scenarios - from $250M to $1B per year - across different NAV multiples (“mNAV”) from 1x to 10x. While that gave us directional intuition around accretive dilution and SPS growth, mNAV is subjective and market-driven, so we pivoted and anchored our thinking in observable benchmarks.
Specifically, we focused on two:
Trading Liquidity: Our stock trades at high velocity, with daily volume in Q2 2025 averaging ~15% of our market cap, substantially higher than peers and 3.1x the ratio observed at MicroStrategy and more than 40x higher than the S&P 500 average.
MicroStrategy’s Capital Formation: In Q1 2025, MSTR raised a total of $7.7B, consisting of $2.0B of convertible debt, $1.3B of preferred equity issued in underwritten offerings, and $4.4B via the sale of common stock. On a monthly basis, this represents approximately 3% of their average Q1’25 market cap of ~$82B.
Using those as guideposts, we modeled what capital formation could realistically look like for DFDV, and how that would translate to SPS growth. We then pressure-tested those assumptions across a range of timelines and mNAV ranges to land on targets we believe are achievable.
That brings us to our target.
The Target
As of July 14, 2025, with 857,749 SOL held and 18.8M total shares outstanding, our SPS stands at 0.0457. Based on modeled capital inflows and internal treasury deployment assumptions, we are guiding to SPS of 0.1650 by June 2026.
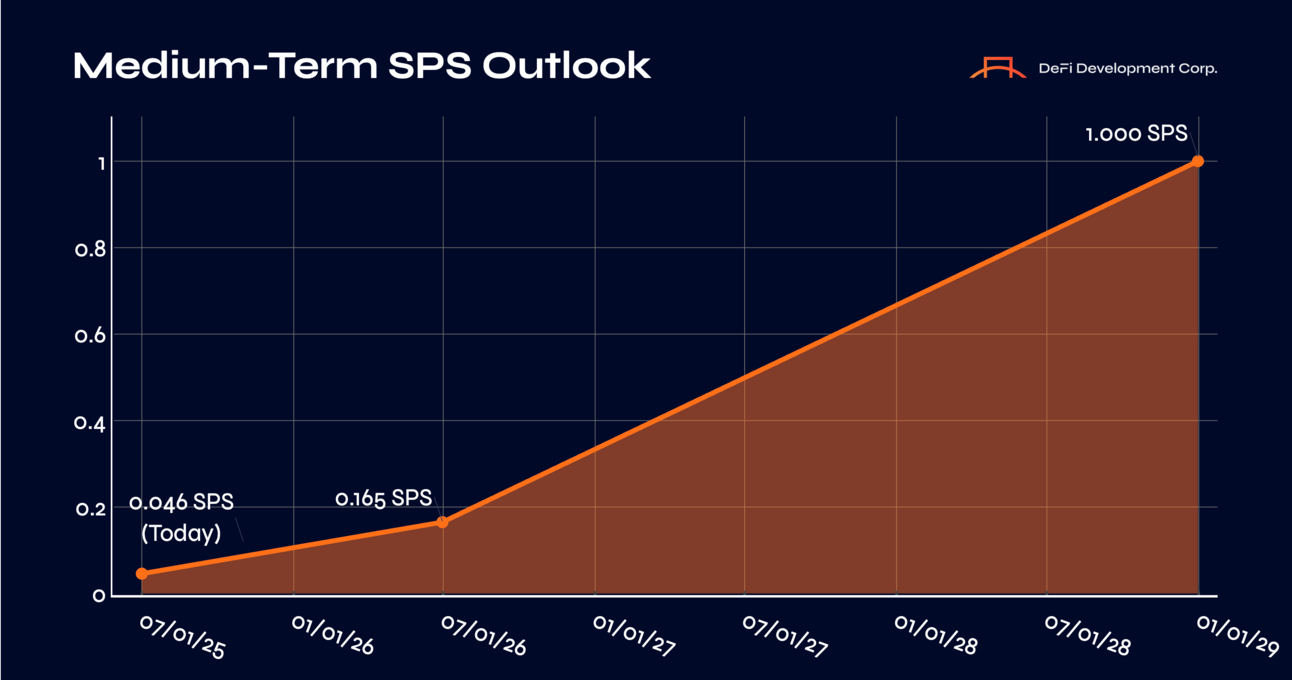
Figure 1: Medium-Term SPS Outlook
That’s 261% growth in SPS in the next twelve months.
We modeled two illustrative capital formation paths:
Scenario 1: Raise $50M per month on average
Scenario 2: Raise $100M per month on average
Our 12-month June 2026 SPS guidance of 0.165 is based on Scenario 1, the more conservative option.
Ambitious & Achievable
At our current ~$510M market cap, raising $50M per month equates to approximately 10% of market cap monthly (or closer to 7% based on our fully diluted market cap of ~$750M), which would be exceptional for a large-scale company.
But we are not at that scale (yet), and we’ve said from the very beginning that we’re not here to copy-paste MicroStrategy’s playbook. We’re here to evolve it.
Our liquidity profile gives us confidence. We’re also confident we can raise at a high pace because we built DFDV for speed. We are a crypto-native team with deep integrations across the Solana ecosystem and growing trust from capital allocators on both sides of the onchain-TradFi bridge.
Lastly, while we’re not offering a forward view on market cap, it’s worth noting that if our market cap increases, these percentage targets become even more conservative. As the denominator grows, the relative size of each monthly raise shrinks.
SPS and Executive Targets
As announced on May 14, 2025, employee compensation is tied directly to SPS growth. The benchmarks and payouts are as follows:
SOLid: 0.085 SPS | 100% Bonus (% of Target Bonus)
LFG: 0.115 SPS | 150% Bonus (% of Target Bonus)
WAGMI: 0.143 SPS | 200% Bonus (% of Target Bonus)
Our 0.165 SPS guidance exceeds even the top tier. The comp structure is tied to April 2026, and this target is for June 2026. As shown in Figure 2, we’re currently on pace to achieve the first target of 0.085 SPS.
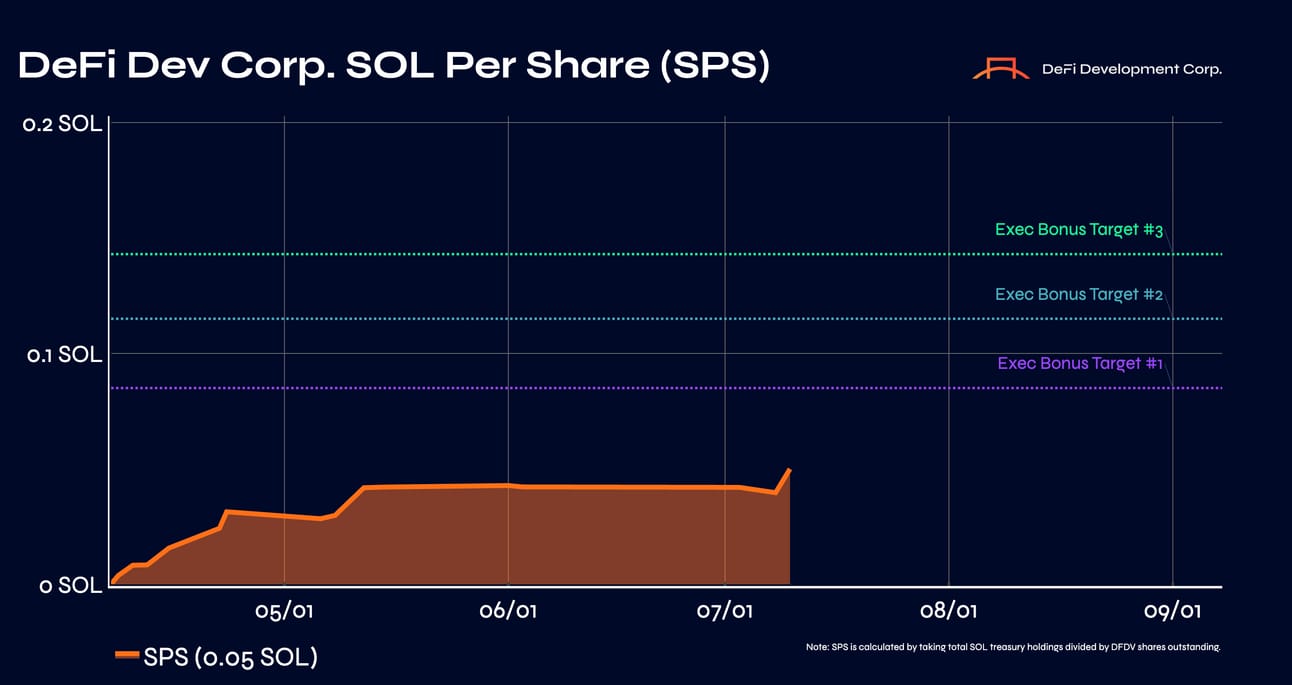
Figure 2: DFDV SPS
A Different Treasury Model
Everything we do, from capital raises to validator operations, is aimed at one outcome: increasing SPS. DeFi Development Corp. is building the most crypto-native, capital-efficient treasury model of any asset in public markets, and SPS is how we track it.
This is our first public guidance on SPS. It won’t be our last, especially as we march toward our medium-term goal of 1.0 SOL per Share by December 2028.
Now, back to stacking SOL.
In Service of SPS,
Joseph Onorati, CEO
Sources
Per Bloomberg, DFDV’s median ADV to market cap was roughly 14.8% in Q2’25.
Per Bloomberg, MSTR’s median ADV to market cap was roughly 4.7% in Q2’25
Forward-Looking Statements: This blog post contains "forward-looking statements" within the meaning of the safe harbor provisions of the U.S. Private Securities Litigation Reform Act of 1995. Forward-looking statements in this blog post include statements regarding the Company’s SPS objectives, expectations regarding operations and financing plans, and can be identified by words such as: "anticipate," "intend," "plan," "believe," "project," "estimate," "expect," strategy," "future," "likely," "may,", "should," "will" and similar references to future periods. Forward-looking statements are neither historical facts nor assurances of future performance. Instead, they are based only on the Company’s current beliefs, expectations, and assumptions regarding the future of its business, future plans and strategies, projections, anticipated events and trends, the economy, and other future conditions. Because forward-looking statements relate to the future, they are subject to inherent uncertainties, risks, and changes in circumstances that are difficult to predict and many of which are outside of the Company’s control. The Company’s actual results and financial condition may differ materially from those indicated in the forward-looking statements. Therefore, you should not rely on any of these forward-looking statements. Important factors that could cause our actual results and financial condition to differ materially from those indicated in the forward-looking statements include, among others, the following: (i) fluctuations in the market price of SOL and any associated losses that the Company may incur as a result of a decrease in the market price of SOL; (ii) the Company’s ability to earn SOL staking rewards; (iii) our ability to access sources of capital on favorable terms, including debt financing and other sources of capital to finance operations and growth; (iv) volatility in our stock price, including due to future issuances of common stock and securities convertible into or exercisable for common stock; (v) the effect of and uncertainties related the ongoing volatility in interest rates; (vi) our ability to achieve and maintain profitability in the future; (vii) the impact on our business of the regulatory environment and complexities with compliance related to such environment including changes in securities laws or other laws or regulations; (viii) changes in the accounting treatment relating to the Company’s SOL holdings; (ix) our ability to respond to general economic conditions; (x) our ability to manage our growth effectively and our expectations regarding the development and expansion of our business; and (xi) other risks and uncertainties more fully in the section captioned “Risk Factors” in the Company’s most recent Annual Report on Form 10-K and other reports we file with the Securities and Exchange Commission. As a result of these matters, changes in facts, assumptions not being realized, or other circumstances, the Company's actual results may differ materially from the expected results discussed in the forward-looking statements contained in this press release. Forward-looking statements contained in this announcement are made as of the original posting date of this blog post, and the Company undertakes no duty to update such information except as required under applicable law.